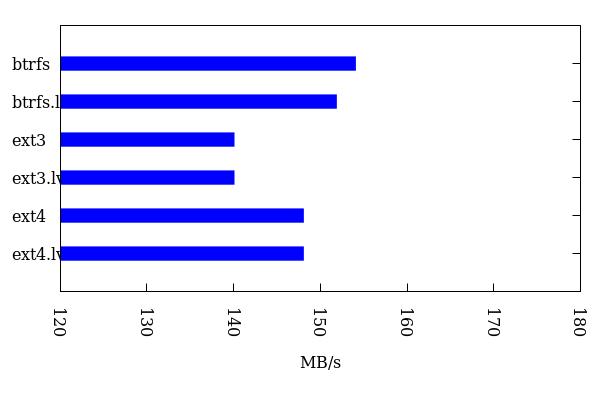
ich versuche gerade mit gnuplot ein paar Bildchen zu HDD Benchmarks zu basteln. Teilweise gelingt mir das auch. Wie ich das mit der Beschriftung hinbekomme, da hänge ich allerdings.
Das ist meine Datendatei:
Code: Alles auswählen
1 btrfs 154.1
2 btrfs.lvm 151.9
3 ext3 140.1
4 ext3.lvm 140.1
5 ext4 148.1
6 ext4.lvm 148.1
Code: Alles auswählen
reset
set terminal pngcairo enhanced font "Times,12" size 400,600
unset key
set style data histogram
set style histogram cluster gap 1
set style fill solid border -2
set boxwidth 0.75
set xtic rotate by 90
set xtic offset 0,-2, graph 0.05
unset ytics
set y2range [120:180]
set y2tics
set y2label 'MB/s' offset -1.0
set xlabel ' '
set size 1, 1
set label 1 'Filesystem' at graph 0.5, -0.5 centre rotate by 180
plot [-1:6] [120:180] 'seq_read.dat' using 3 linetype rgb "blue", '' using 0:(0):xticlabel(2) with line title ''
Code: Alles auswählen
gnuplot seq_read.gnuplot  >x.png
convert -rotate 90 x1.png x.png

Wenn ich aber jetzt noch die Werte rechts vom Balken haben möchte, was ich eigentlich mit der folgenden Änderung der Plotzeile erreichen möchte, dann verschwinden die Balken.
Code: Alles auswählen
plot [-1:6] [120:180] 'seq_read.dat' using 1:3:3 linetype rgb "blue" with labels, '' using 0:(0):xticlabel(2) with line title ''

(Ja. ich weiss, da sind noch andere Darstellungsfehler).
Als Basis habe ich das benutzt:
http://www.phyast.pitt.edu/~zov1/gnuplo ... ogram.html
Habt Ihr da vielleicht einen Tip für mich?

